I’m finding it a little challenging in developing dashboards beyond a line and pie chart. Looking for advice from experts who can guide me towards resources or personal tips and tricks.
I would attach my current dashboard progress and dataset link for reference, but new users are only allowed to put 1 media link.
My goal is to use DDOS datasets to generate intricate dashboards and insightful GUIs, and use that as a template later for when I want to run real data and apply Machine Learning on top of it.
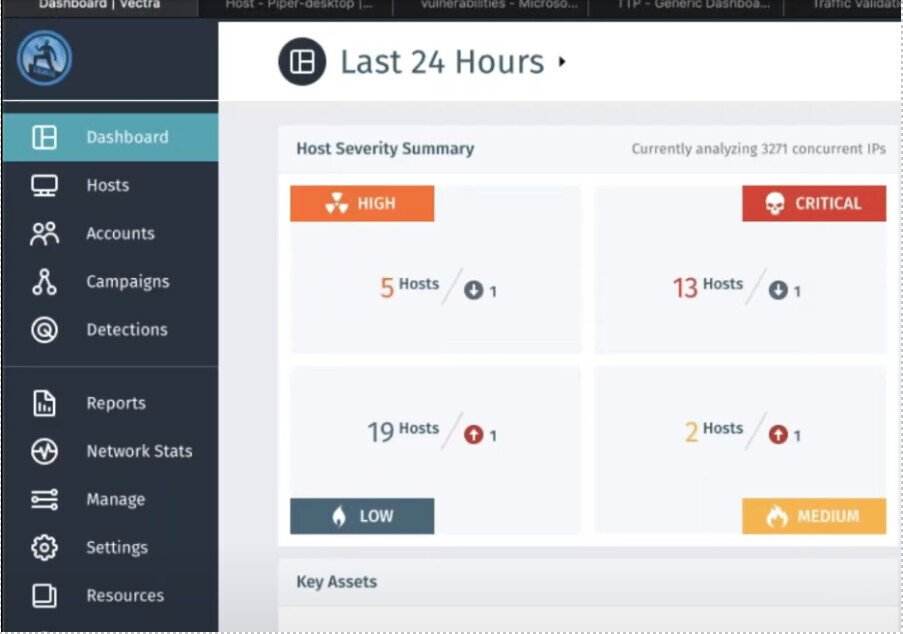
Is this dashboard layout possible using vega-lite?