Hi!
I encountered a problem when using plot.js: in order to implement the zoom function, I added sliders on both sides of the coordinate axis to change the value of the coordinate axis and achieve the function of zoom.
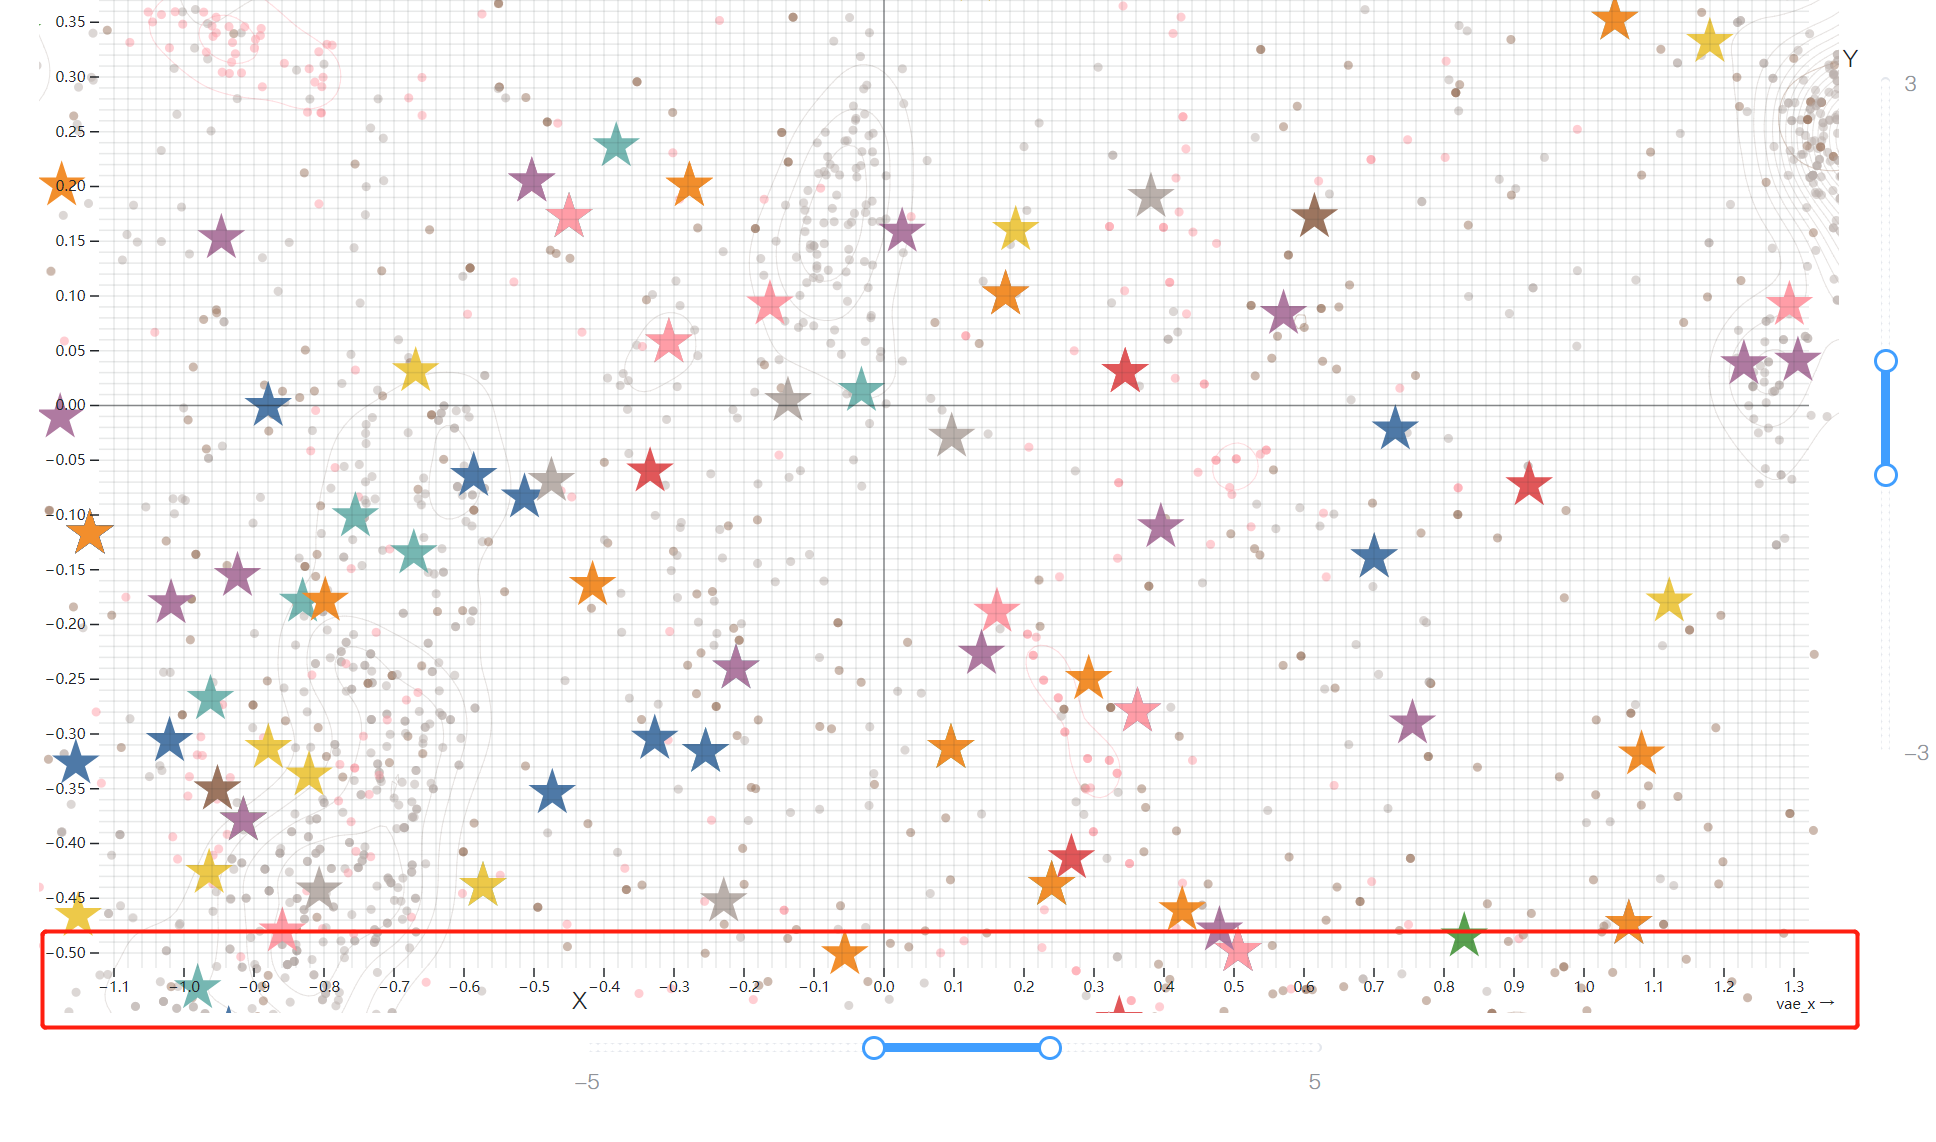
However, I found that in this process, the picture exceeded the coordinate axis. How can I hide the part that exceeds? Thanks for your help.
let ps = Plot.plot({ x: { domain: this.x }, y: { domain: this.y }, inset: 10, width: 1200, height: 800, marks: oldData, color: { legend: true }, }); $("#plot").append(ps);
see the clip option
Excuse me, I just carefully read the document and thought about it, but I still don’t understand how to solve this problem. I’m just starting to learn JS, can you provide me with a more detailed answer? Looking forward to your response.
If you add clip: true to any of your marks (which seem to be in the oldData array, in the code you’re sharing), it will be clipped to the frame.
Thank you very much indeed!
Hi. How did you add the sliders on the coordinate axis?
A component in the component library I am using (https://element.eleme.cn/#/zh-CN/component/slider), then use relative position and absolute position.
1 Like