I am visualizing the distribution of data with ‘Observable Plot’.
This data has x, y-axis values, but I only want to use them as location coordinates and don’t want to show the information on the axis.
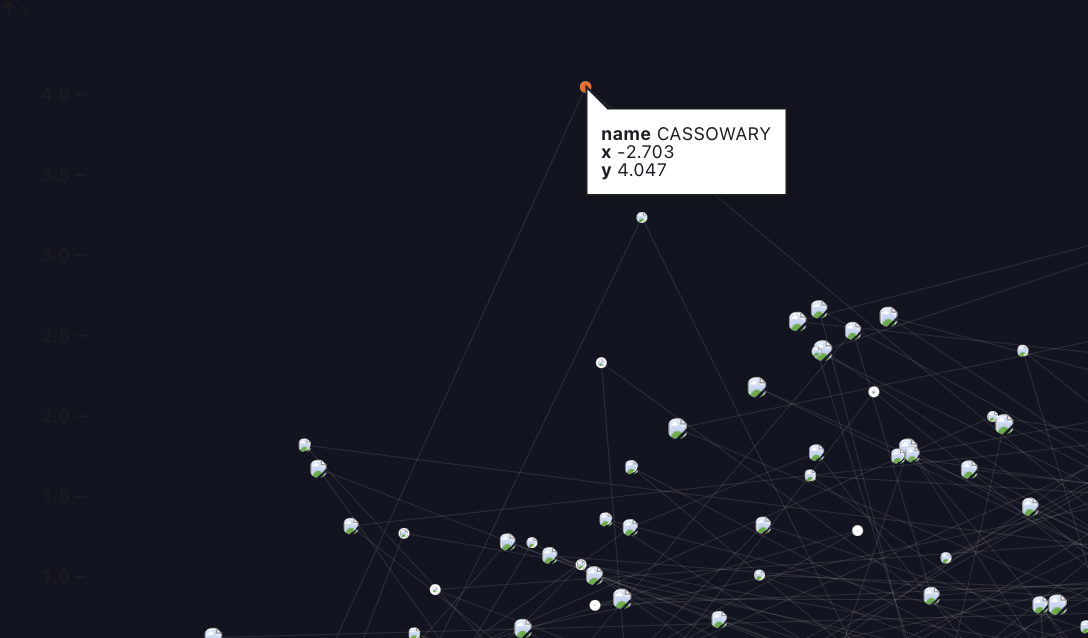
How can I make this invisible on the axis and in the tooltip?

You can use the title channel to specify what gets displayed.
You can also upvote this issue, which we are actively working on: Custom format for the tip mark? · Issue #1612 · observablehq/plot · GitHub