 5-day Forecasts of the marine conditions in the North Sea (updated twice a day)
Observable Framework + API-driven forecast services + advanced OpenLayers/ol-ext mapping (WMTS, WebGL, synchronized maps)
Hi everyone! ![]()
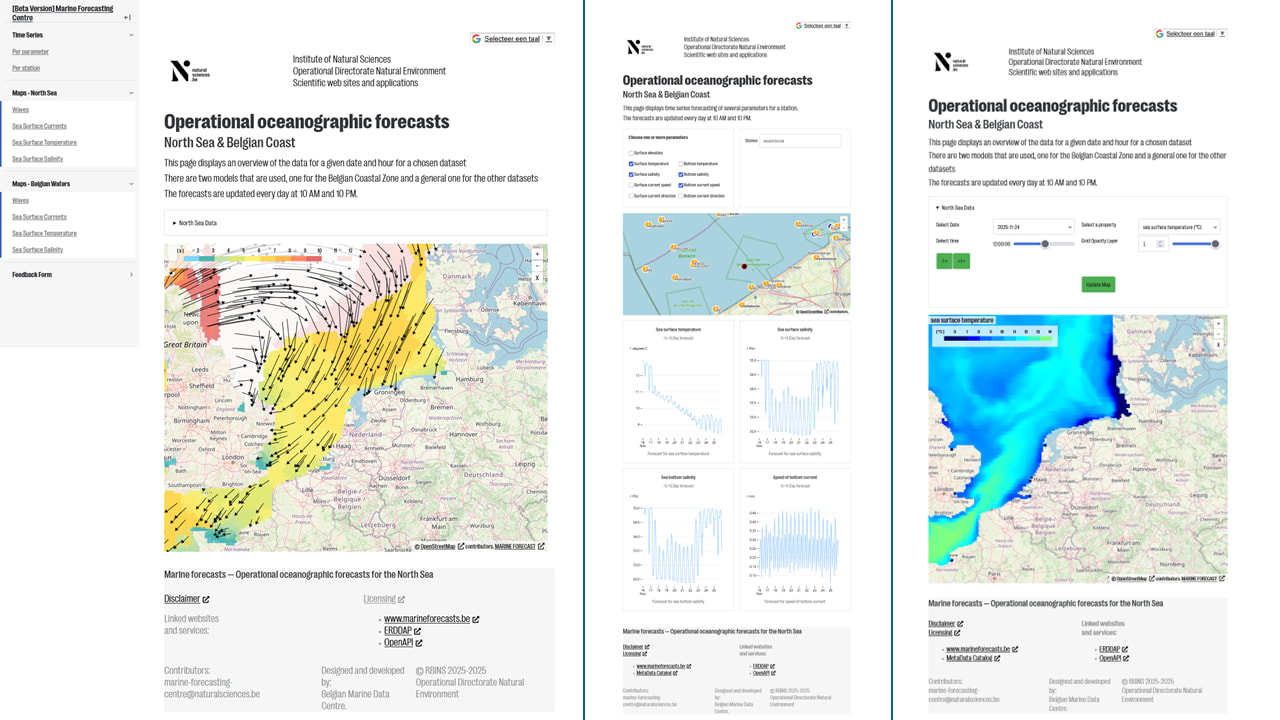
Here’s a technical introduction to our Marine Forecasting Centre dashboard, published using Observable Framework and driven by marine model data.
Live app: https://dataviz.naturalsciences.be/dashboard/mfc/
The dashboard provides interactive access to operational marine forecasts (currents, waves, water levels, winds, etc.), used by researchers and maritime stakeholders.
Below is a concise breakdown of the architecture and mapping stack.
 Architecture Overview
The site is built with Observable Framework and deployed as a fully static site.
All forecast datasets and map layers are streamed in via institutional REST services, ensuring the UI always reflects the latest model output without needing rebuilds.
A custom sitemap builder is integrated into the build pipeline to improve SEO and automate indexing of all dashboard pages.
 Data Layer — API-Based Marine Forecast Services
Data ingestion relies on a suite of backend services that expose:
-
gridded forecast fields
-
WMTS-ready map layers
-
station-based time Series
-
model metadata (run times, validity windows, parameters)
Everything is loaded at runtime.
The dashboard separates visualization from data delivery, so updates in the marine models immediately propagate to the interface.
 Mapping Stack — OpenLayers, ol-ext, WMTS, WebGL, Synchronization
The dashboard uses an advanced OpenLayers setup with ol-ext enhancements to support high-performance, interactive marine visualizations:
Base capabilities
-
Standard OpenLayers modules for tile layers, vector layers, projections, and GeoJSON ingestion
-
OSM and custom basemaps as tile layers
-
Rendering of forecast rasters and vector fields
WMTS Support
-
Automatic reading of WMTS capabilities documents
-
Generation of layer options from the server description
WebGL Rendering
-
WebGL-powered vector and point layers for smoother rendering of dense spatial datasets
-
Accelerated drawing of model outputs, station layers, and thematic overlays
-
Better interactivity when updating forecast time steps or switching variables
ol-ext Enhancements
We use ol-ext for features such as:
-
Map synchronization (multiple maps moving together)
-
Chart-based symbol styles (for stations, markers, and indicators)
-
Extended controls and styling utilities
-
Enhanced text, fill, and stroke options
These extensions let us build a richer UI without custom low-level map code.
Vector Data Handling
-
GeoJSON parsing for stations, coastlines, and model sample points
-
Integration of vector overlays on top of WMTS layers
-
Flexible styling through OL + ol-ext (fills, strokes, labels, charts)
Together, this forms a hybrid raster–vector mapping environment optimized for marine forecast data.
 Data Parsing & Time Management
Lightweight D3 utilities support:
-
CSV parsing when loading station or extracted time-series data
-
Time formatting for model cycles and forecast horizons
-
Consistent summarization of timestamps across model types
 Build & Deployment
The project compiles into a static directory using Observable’s build pipeline.
Additional steps:
-
clean asset/cache directories
-
copy media assets into Framework’s
_file/pipeline -
generate a sitemap automatically
-
support both Linux and Windows build servers
Deployment is handled through Observable tooling combined with institutional infrastructure.
Happy to discuss any technical or architectural details!
ystojanov@naturalsciences.be / yvan.stojanov@yahoo.fr
fstrobbe@naturalsciences.be / bedic@naturalsciences.be