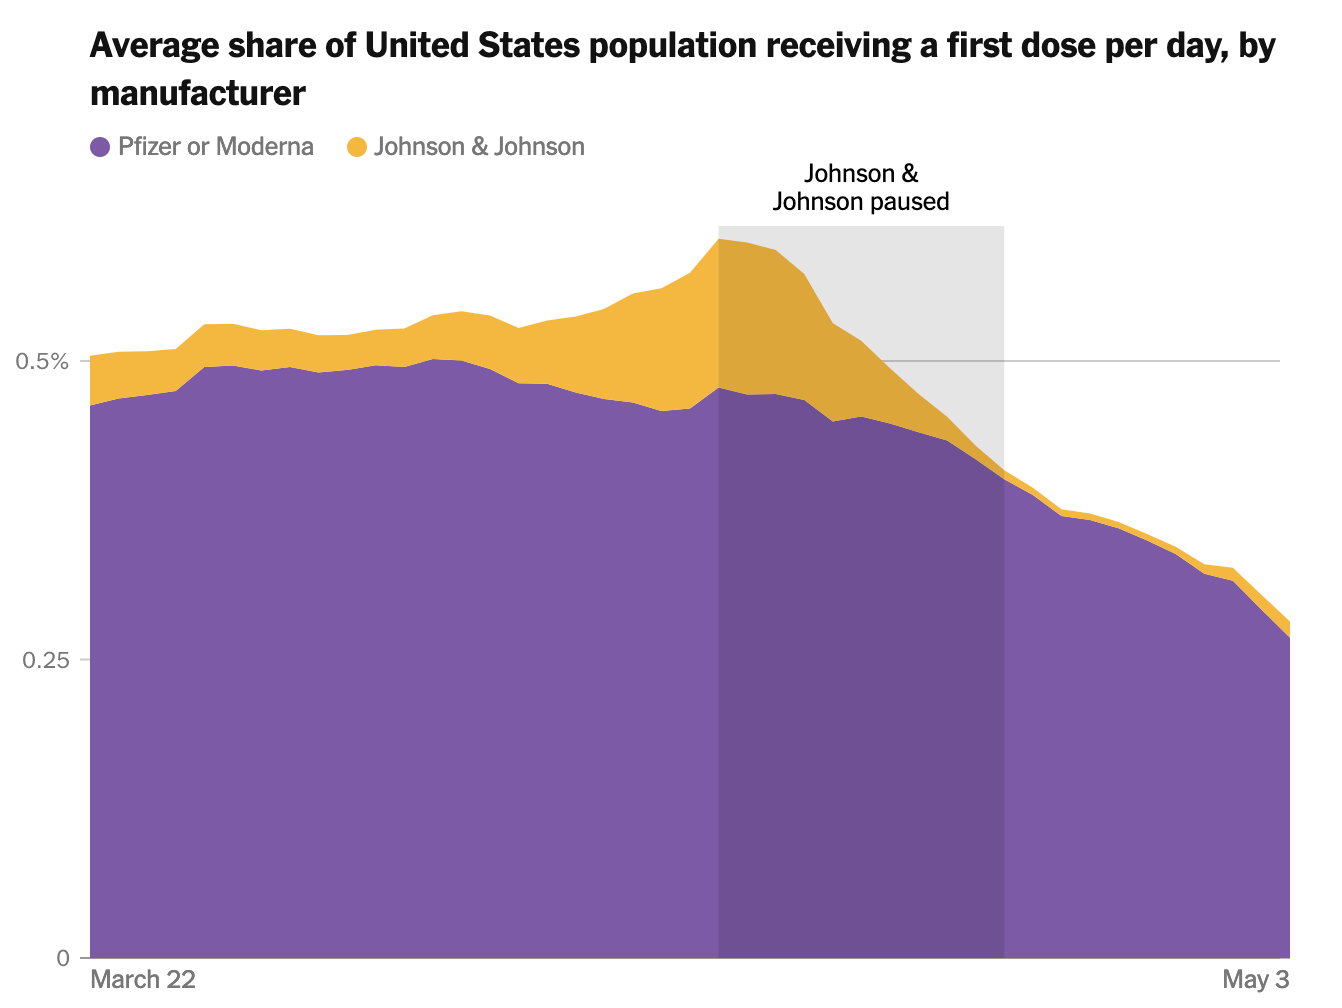
Hello! In effort to better annotate my Plot charts, I’ve been attempting to figure out how to draw a rect on a chart based on explicit values. A good example of this can be found on this NYT chart (via this piece):
Something similar to the grey “Johnson & Johnson paused” block is what I’m after. I was able to get something close to this via a pair of rules, but when it comes to rendering this with the inner area filled I’ve hit a wall.
Having to specify x1,y1,x2,y2 is a little tedious (it seems like Plot.cell supports giving data like [[x₀, y₀], [x₁, y₁], [x₂, y₂], …], but only for band scales), but it works in a pinch!
Ah yeah, this was what I was looking for. Thank you @mbostock! (And asg017 + Fil for the other methods!)
I figured there was a way to make this happen without having to explicitly declare the max value of the y. I had been goofing around with rectX but I can see now why it didn’t work.
Is it by design that barX and barY do not work similarly to what asg017 floated via Plot.cell? I think at one point I assumed it would use the first index as x1 and second index as x2, ala:
Yes, Plot.cell requires that both x and y are ordinal, which is not what you want here.
We could add more shorthand to Plot.barX and Plot.barY but the more shorthand we add the more ambiguities it creates, so I think it’s better to be explicit. Another way you can write the above is:
I think it would also be possible to make Plot.rect allow either x or y to be optional, so that you could cause Plot.rectX or Plot.rectY here instead of Plot.barX or Plot.barY; they should be the same if you’re only specifying a single quantitative dimension. I’ll file an issue for that.