Discussion: using Observable for more useful JavaScript benchmarking

TL;DR: Could Observable be used to make notebook that gives us richer benchmarking information?

Benchmarking sites for JavaScript typically present the results like this:

image
image
image

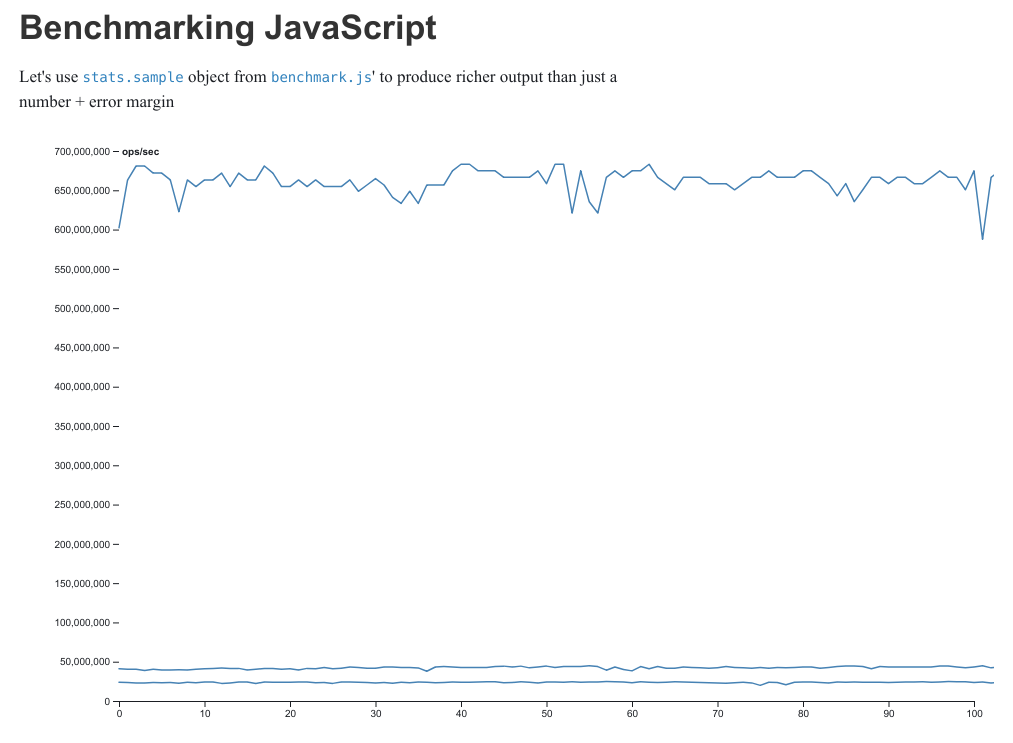
As I’m sure people coming to a data-viz oriented forum will know, this is a needlessly reductive and unhelpful way of presenting the data that will give very misleading results. A distribution or a line plot showing iteration vs performance would give us a much better idea of the actual characteristics. We could even cram the two into one by using a stacked bar chart to show the distribution of ops/second, while making the gradient depend on which iteration the data point was from, or a horizon chart or ridgeline plot which plots each run (as in a batch of iterations) separately.

So I’m thinking: wouldn’t it be nice if we had some kind of Benchmarking Template notebook that let you benchmark snippets of JavaScript code, and then produces richer data visualizations that actually give you much more workable information?

Also, given that we would be running a full notebook environment it would then be exceedingly easy to modify and get more detailed information compared to traditional benchmarking sites.

Sadly, there is a lot more to benchmarking that just a nested for-loop + timing before and after. I’m not even talking about the statistics of it: we have to consider whether or not the JS engine can optimize the function or not (for example, eval never is, and using closures complicates the picture too), whether we perform DOM operations during the measurements that may interfere with it, and so on.

I don’t know the best practices to ensure that code snippets are run like JS would normally run on a webpage. I think that’s part of why jsperf still is seen as more reliable though, since it uses PHP to statically generate a site with all the code. Who knows, perhaps the way Observable works is inherently getting in the way of that.

Does anyone here have any ideas where to start with that?

Anyway, for the interested, here is some further viewing/reading on this topic:

Kay Ousterhout - Software Performance: A Shape, Not A Number (StrangLoop 2018 talk on YouTube) - this was about performance measurement of live systems rather than benchmarking, but most of the ideas translate directly

StackOverflow: Which JS benchmark site is correct? - touches on the fact that many benchmarking sites come with their own overhead and interference that makes the resulting values suspicious

Why Is Looping Through An Array So Much Faster Than JavaScript’s Native IndexOf? - A rant an answer I gave on StackOverflow about misleading benchmarking practices.

Zed Shaw - Programmers Need To Learn Statistics Or I Will Kill Them All - great insights (if you can get past the anger) into common mistakes in benchmarking

2 Likes

Edit: this tangential discussion is a distraction from whatever you were trying to talk about. Removing my half of it.

Absolutely.

This is where I strongly disagree. If nothing else, assuming this without ever checking if this is true is just not the way to test hypothesis.

Also, as Anscombe’s quartet and the more recent Datasaurus Dozen famously show, reducing your output to one number can masks a wild variety of behaviour that can be very important:

https://imgur.com/a/Kfj6Jit

Now, I don’t think you have to worry about any T-rexes appearing in your benchmarks, but you could still miss important clues. For example, some code actually deoptimises on repeated runs (scroll down to the ClosureObject part), which may not be visible if you don’t do enough runs, because the later runs may still be masked by the faster, earlier runs.

Anyway, I’ve started a barebones thingy with Benchmark.js:

It’s pretty crappy at the moment, but it’s a start. I just took the basic example from Benchmark.js and added a multiline chart.

TODO:

  • better inputs for code snippets
  • fine-grained controls over relevant benchmark.js configuration, like minimum runs
  • more plots!
3 Likes

If you believe microbenchmarks suit your needs, fine, but asserting that “the performance characteristics of most microbenchmarks are pretty straightforward” or that “vast majority of microbenchmarks don’t run into some weird case where code deoptimizes when it runs more” without a shred of evidence to back that up is bogus. Did you even check the link? It’s about closure-based object generators, which everyone seems to be using these days.

I have four links in the top post.

One by Zed Shaw about statistics and with very clear explanations of how everyone is doing them wrong and why they are wrong and what to do instead. So maybe properly explain the things he claims do not apply to your microbenchmarks instead of just asserting that everything is fine.

One by me to a SO answer by me pointing out inconsistencies between benchmarking sites that most people don’t notice because they don’t bother to check. Did you verify your microbenchmarks on different contexts and on different benchmarking sites, or do you think that running it once on jsperf your high-performance laptop is representative for how the code will run on mobile? Because it isn’t, up until a few months ago things like TypedArrays behaved significantly different between them, for example.

One to another SO answer by me pointing out how a ton of people failed to even benchmark .indexOf() properly. It doesn’t get more straightforward than that and apparently just about every other answer there still screwed that up, and worse: nobody else seemed to notice! Don’t tell me benchmarking is “straightforward” when when I have a link with direct evidence of people screwing up something as trivial as benchmarking .indexOf().

And perhaps most importantly: one by Kay Ousterhout showing directly how a simple extension of the presentation immediately enriches the information you can get from your performance measurement without losing anything. Which brings me to my final point: even if you still disagree with everything I stated, even if you believe the existing style of benchmarking is all you need, fine, that’s not my problem. But why on earth should that motivate you to argue that the more enriched benchmarks I propose have no value, which is what you are basically doing? What exactly do you have to lose if other people build them?

In case you have yet to come across it, here is a notebook which demonstrates writing and running benchmarks in Observable.

While the harness returns results according to TAP, should be straightforward to pipe the text results to a TAP parser and subsequently to customized plotting libraries.

2 Likes