Dear Community,
I having trouble with an observable assignment right now on how to use plot function and stroke correctly
Here is my observable notebook:
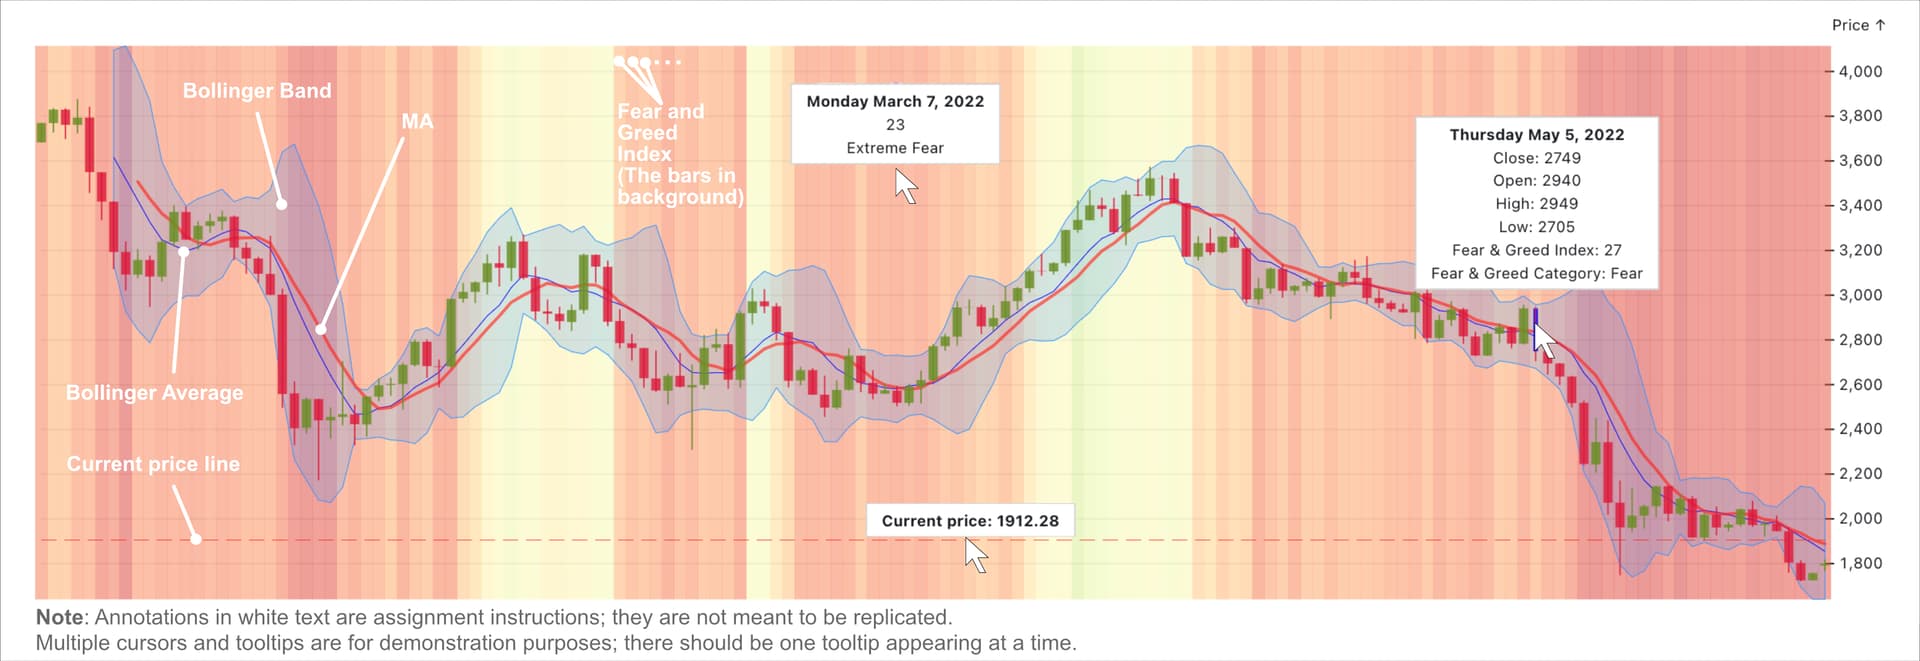
I need to replicate this image, by far I have finished 80% of the work, however, one of the difficult things is that I need to create a stroke function to replicate the ▴fearGreedIndex data in the notebook above using plot.
I was stuck on how to properly use this line of code to create an FGI line that uses color to the range of the ▴fearGreedIndex.
Plot.ruleX(data_final, {
x: “date”,
fill: “red”,
stroke: “blue”,
strokeWidth: 3
}),
An important concept in Plot is that there is only one color scale for the whole plot. So you’ll want to configure that scale to use the appropriate scheme, see more here:
You’ll also want to make sure the ruleX that is drawing those fearGreedIndex marks is mapping the fearGreedIndex to the stroke channel. You’ll also want to make sure other marks are not mapping data values to a stroke or fill channel (they should be hardcoding the colors, like the area chart is).
You can see an example here: