I ported the Focus + Context Notebook, so that it’s usable in Framework. Here’s a link to my repo/file. I also added the ability for the chart to zoom in on the last three months of data on page load, like so, after creating the focus and context portions:
    const dataExtent = d3.extent(data, d => d.timestamp);
    const endDate = dataExtent[1];
    const startDate = new Date(endDate);
    startDate.setMonth(startDate.getMonth() - 3);

    setTimeout(() => {
        dispatch.call("timeWindow", "reset", [startDate, endDate]);
    }, 0);
The initial zooming works, but it doesn’t fill the entire chart-area on the x-direction. As soon as I pan the chart, it snaps to the right and fills the entire chart area:
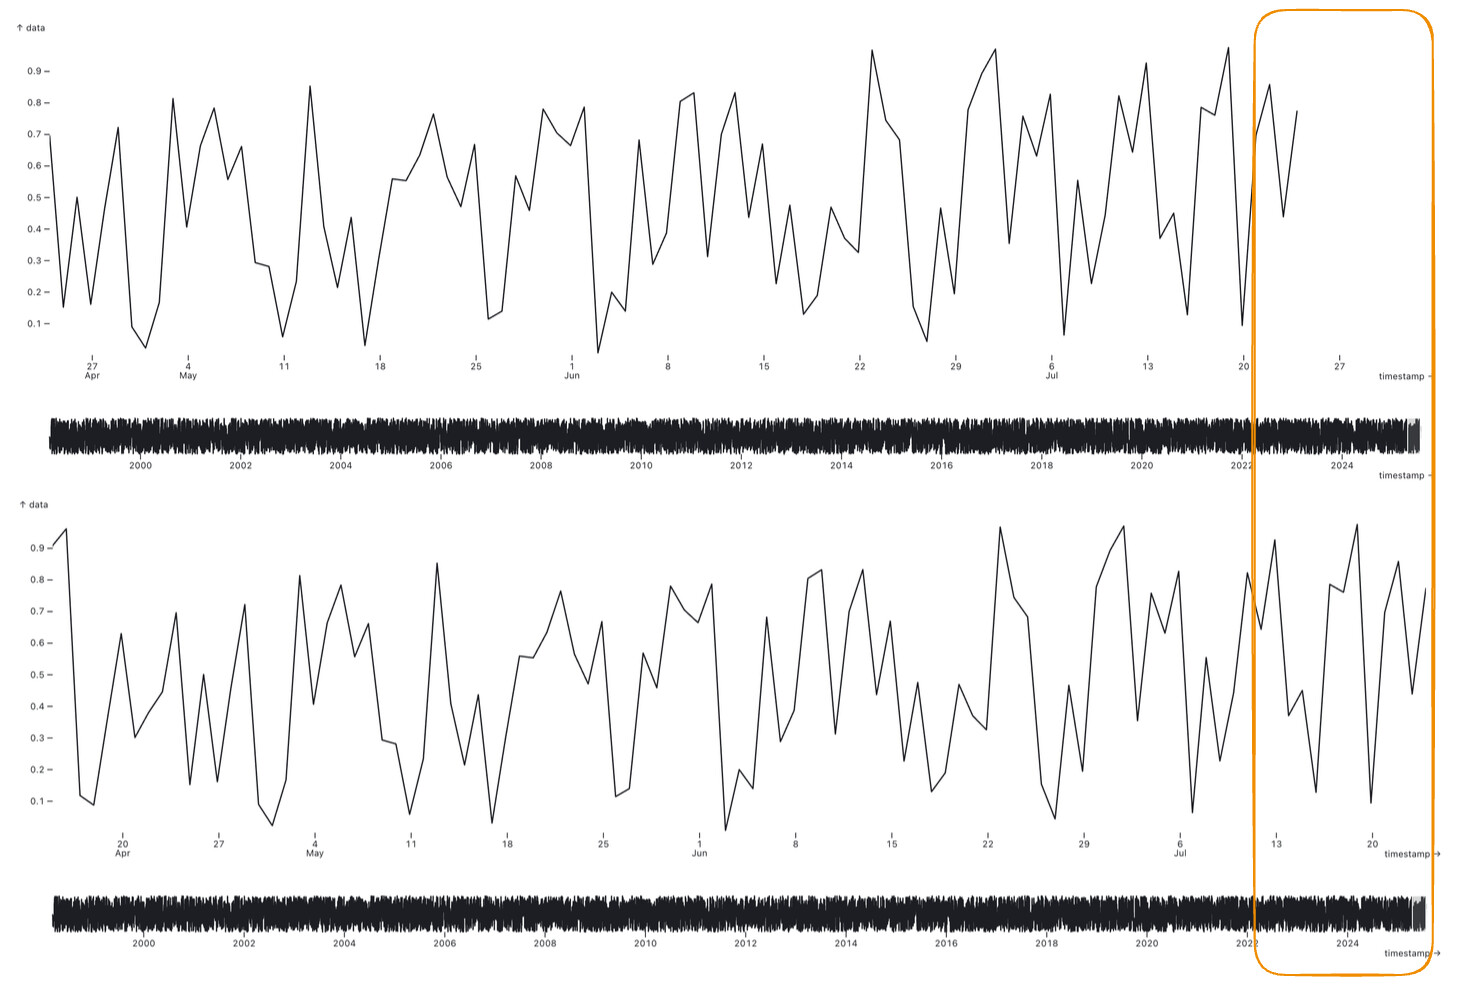
Why is the chart misaligned on first page-load?