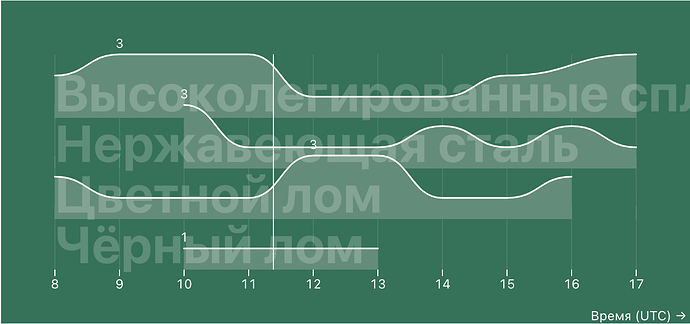
Hi! I’m rather new to Plot so please excuse my lack of knowledge. I have this plot of the count of clients that have arrived to the facility each hour during the working hours. And for some reason when the count is 0, the area mark cuts off and I can’t wrap my head around the ways to fix it.
Plot.areaY(
      deals.filter((d) => {
        const dealDate = new Date(d.time_arrival);
        return dealDate.toDateString() === date.toDateString();
      }),
      Plot.groupX(
        { y: "count", sort: "x" },
        {
          x: (d) => new Date(d.time_arrival.getUTCHours()).getTime() + 4, //manually fixing timezone difference, since it's irrelevant to this prototype
          y: "id",
          fy: "destination_id",
          curve: "bump-x",
          fill: "#588d7a",
          opacity: 1
        }
      )
    ),
Lurking around the discussions I found this one, with the opposite problem, but still no luck with figuring out how to fix mine.
I tried a custom reducer to substitute the supposedly NaN values by 0, but i can’t figure out what to compare datapoint’s value to, since the value in the gaps is neither 0 nor undefined. Can you help me figure this one out?


