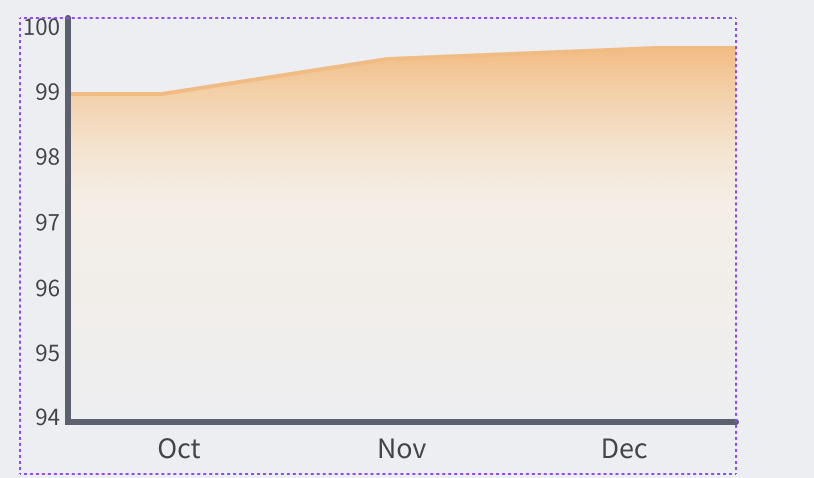
I’m building a graph using D3 and I need to cut off the excess size of the x and y lines , which have a .domain class, I have circled the areas I want to remove :

I have built a sandbox here
export const App = () => {
  const ref = useRef<SVGSVGElement | null>(null);
  const aapl: DataPoint[] = [
    { month: 'Jan', value: Math.random() * 100 },
    { month: 'Feb', value: Math.random() * 100 },
    { month: 'Mar', value: Math.random() * 100 },
    { month: 'Apr', value: Math.random() * 100 },
    { month: 'May', value: Math.random() * 100 },
    { month: 'Jun', value: Math.random() * 100 },
    { month: 'Jul', value: Math.random() * 100 },
    { month: 'Aug', value: Math.random() * 100 },
    { month: 'Sep', value: Math.random() * 100 },
    { month: 'Oct', value: Math.random() * 100 },
    { month: 'Nov', value: Math.random() * 100 },
    { month: 'Dec', value: Math.random() * 100 },
  ];
  // Declare the chart dimensions and margins.
  const width = 928;
  const height = 500;
  const marginTop = 20;
  const marginRight = 30;
  const marginBottom = 30;
  const marginLeft = 40;

  useEffect(() => {
    if (ref.current) {
      // Declare the x (horizontal position) scale.
      const x = d3
        .scaleBand()
        .domain(aapl.map((d) => d.month))
        .range([0, width - marginRight])
        .padding(0.1);

      // Declare the y (vertical position) scale.
      const y = d3
        .scaleLinear()
        .domain([
          0,
          d3.max(aapl, (d) => d.value * 1.05),
        ] as Iterable<d3.NumberValue>)
        .range([height - marginBottom, marginTop]);

      // Declare the area generator.
      // Area generator
      const area = d3
        .area<DataPoint>()
        .x((d) => {
          const xValue = x(d.month); //
          return xValue !== undefined ? xValue + x.bandwidth() / 2 : 0;
        }) // Center the area in the band
        .y0(y(0))
        .y1((d) => y(d.value));

      //Line generator
      const line = d3
        .line<DataPoint>()
        .x((d) => {
          const xValue = x(d.month); //
          return xValue !== undefined ? xValue + x.bandwidth() / 2 : 0;
        }) // Center the area in the band
        .y((d) => y(d.value));
      // Create the SVG container.
      const svg = d3
        .select(ref.current)
        .attr('width', width)
        .attr('height', height)
        .attr('viewBox', [0, 0, width, height])
        .attr('style', 'max-width: 100%; height: auto;');

      const areaData = area(aapl);

      const lineData = line(aapl);

      //create gradient fill
      const lg = svg
        .append('defs')
        .append('linearGradient')
        .attr('id', 'graphGradient')
        .attr('x1', '0%')
        .attr('x2', '0%')
        .attr('y1', '0%')
        .attr('y2', '100%')
        .attr('gradientUnits', 'userSpaceOnUse'); //since its a vertical linear gradient

      lg.append('stop').style('stop-color', '#FBB979');
      lg.append('stop').attr('offset', '46%').style('stop-color', '#FFEDD6');

      lg.append('stop')
        .attr('offset', '100%')
        .style('stop-color', '#FFEDD6')
        .style('stop-opacity', '0');

      // Append a path for the area (under the axes).
      svg
        .append('path')
        .attr('fill', 'url(#graphGradient)')
        .attr('d', areaData);

      // Append a path for the line (over the area).
      svg
        .append('path')
        .attr('fill', 'none')
        .attr('stroke', '#FBB979')
        .attr('stroke-width', 2)
        .attr('d', lineData);

      // Add the x-axis.
      const xAxis = svg
        .append('g')
        .attr('transform', `translate(0,${height - marginBottom} )`)
        .attr('class', 'x-axis')
        .call(
          d3
            .axisBottom(x)
            .tickSizeInner(0)
            .tickSizeOuter(0)
            .ticks(width / 80)
            .tickPadding(12)
        );

      // Add the y-axis, remove the domain line, add grid lines and a label.
      const yAxis = svg
        .append('g')
        .attr('transform', `translate(${marginLeft},0)`)
        .attr('class', 'y-axis')
        .call(
          d3
            .axisLeft(y)
            .ticks(height / 40)
            .tickPadding(0)
        );
      // .call(g => g.select('.domain').remove());

      //add styles to ticks
      xAxis.selectAll('.tick line').remove();
      yAxis.selectAll('.tick line').remove();
      yAxis.selectAll('.tick text').attr('class', 'Body Body-XS');
      xAxis.selectAll('.tick text').attr('class', 'Body Body-Small');
      // xAxis.selectAll('.tick text').attr('transform', 'translate(0,8)');

      yAxis
        .select('.domain')
        .attr('class', 'domain stroke-neutral-600 stroke-[3px]');
      xAxis
        .select('.domain')
        .attr('class', 'domain stroke-neutral-600 stroke-[3px]');
    }
  }, [ref]);

  return <svg ref={ref}></svg>;
};
