Hi, I’m trying to create a histogram to plot distribution and one thing I was trying to do is to have the bin at which one particular value falls under highlighted. For example, something like this:
I haven’t been able to figure it out yet but would really appreciate any help!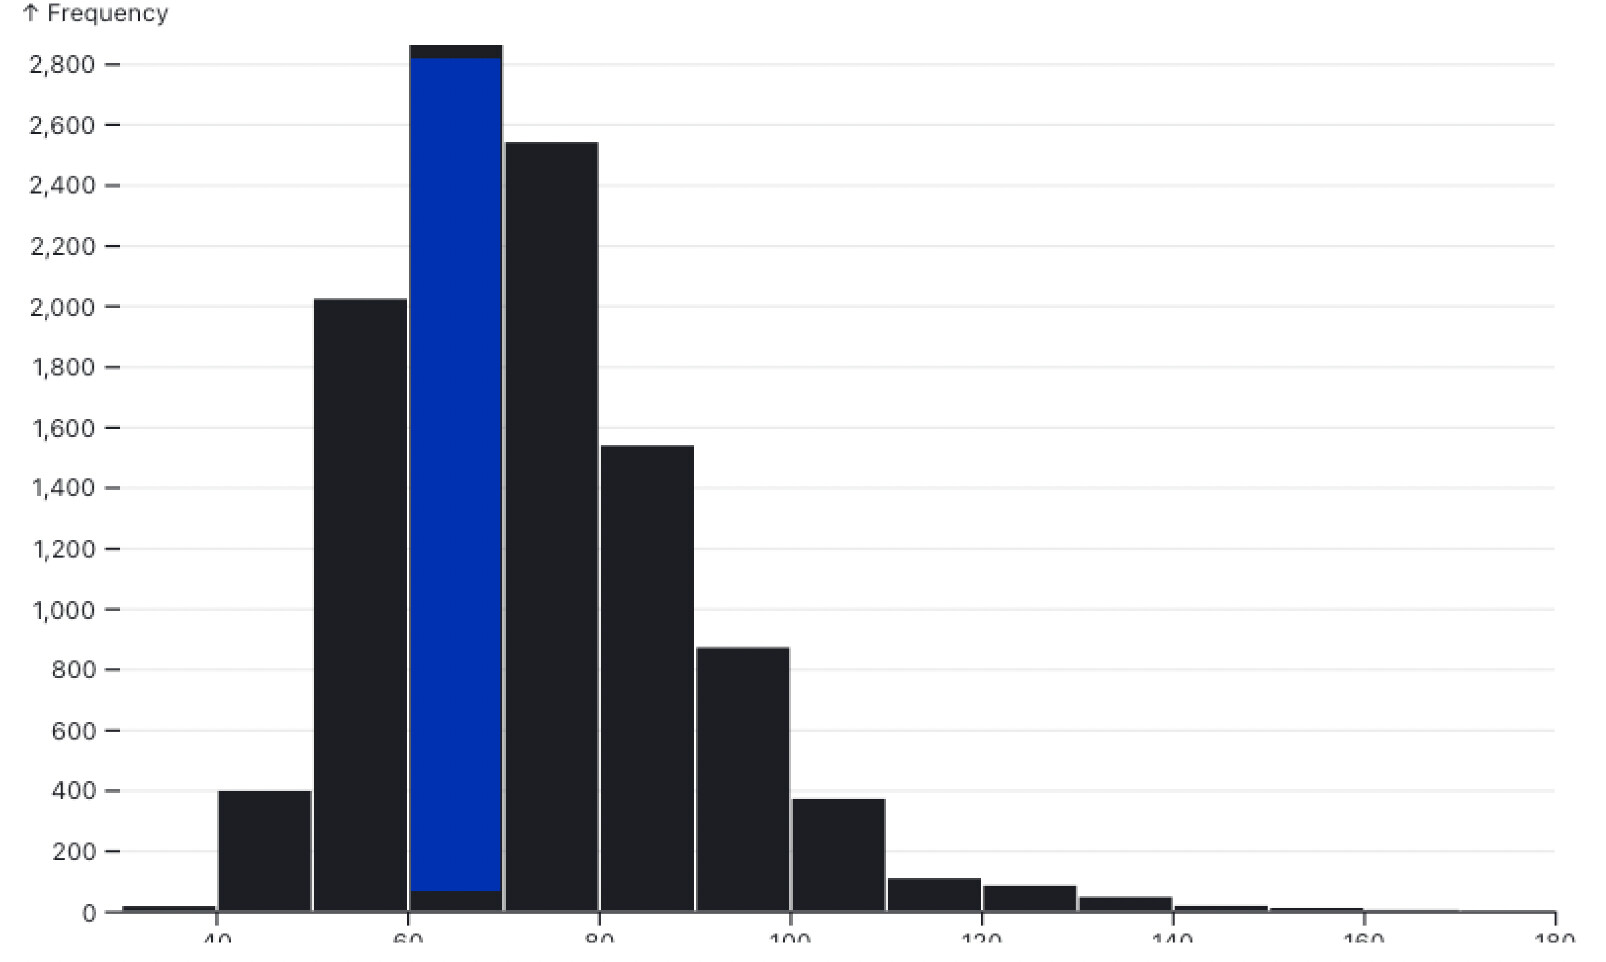
Related topics
| Topic | Replies | Views | Activity | |
|---|---|---|---|---|
| Histogram Return Hovered Bin's Values | 1 | 612 | December 15, 2021 | |
| Histogram with Plot does not show a bar for a single value array | 1 | 384 | May 26, 2021 | |
| Using Plot to present a histogram binned by hour? | 7 | 1441 | February 3, 2022 | |
| Plot: Can I use Bin and Stack together? | 2 | 93 | January 6, 2025 | |
| Highlight specific series on stacked chart | 2 | 207 | August 10, 2023 |