I would like to have two interactive visuals appear side-by-side (it would require a wide browser, ~2000px so not mobile friendly). One example we’re working on
includes an interactive heatmap on top (clicking on the row dendrogram clusters, grey trapezoids on the right side) sends the selected list of genes for enrichment analysis and displays the results as a bar graph as well as text below the heatmap. However, it can be difficult to interact with these visuals because they are stacked on top of one another and can require scrolling (see screenshot)
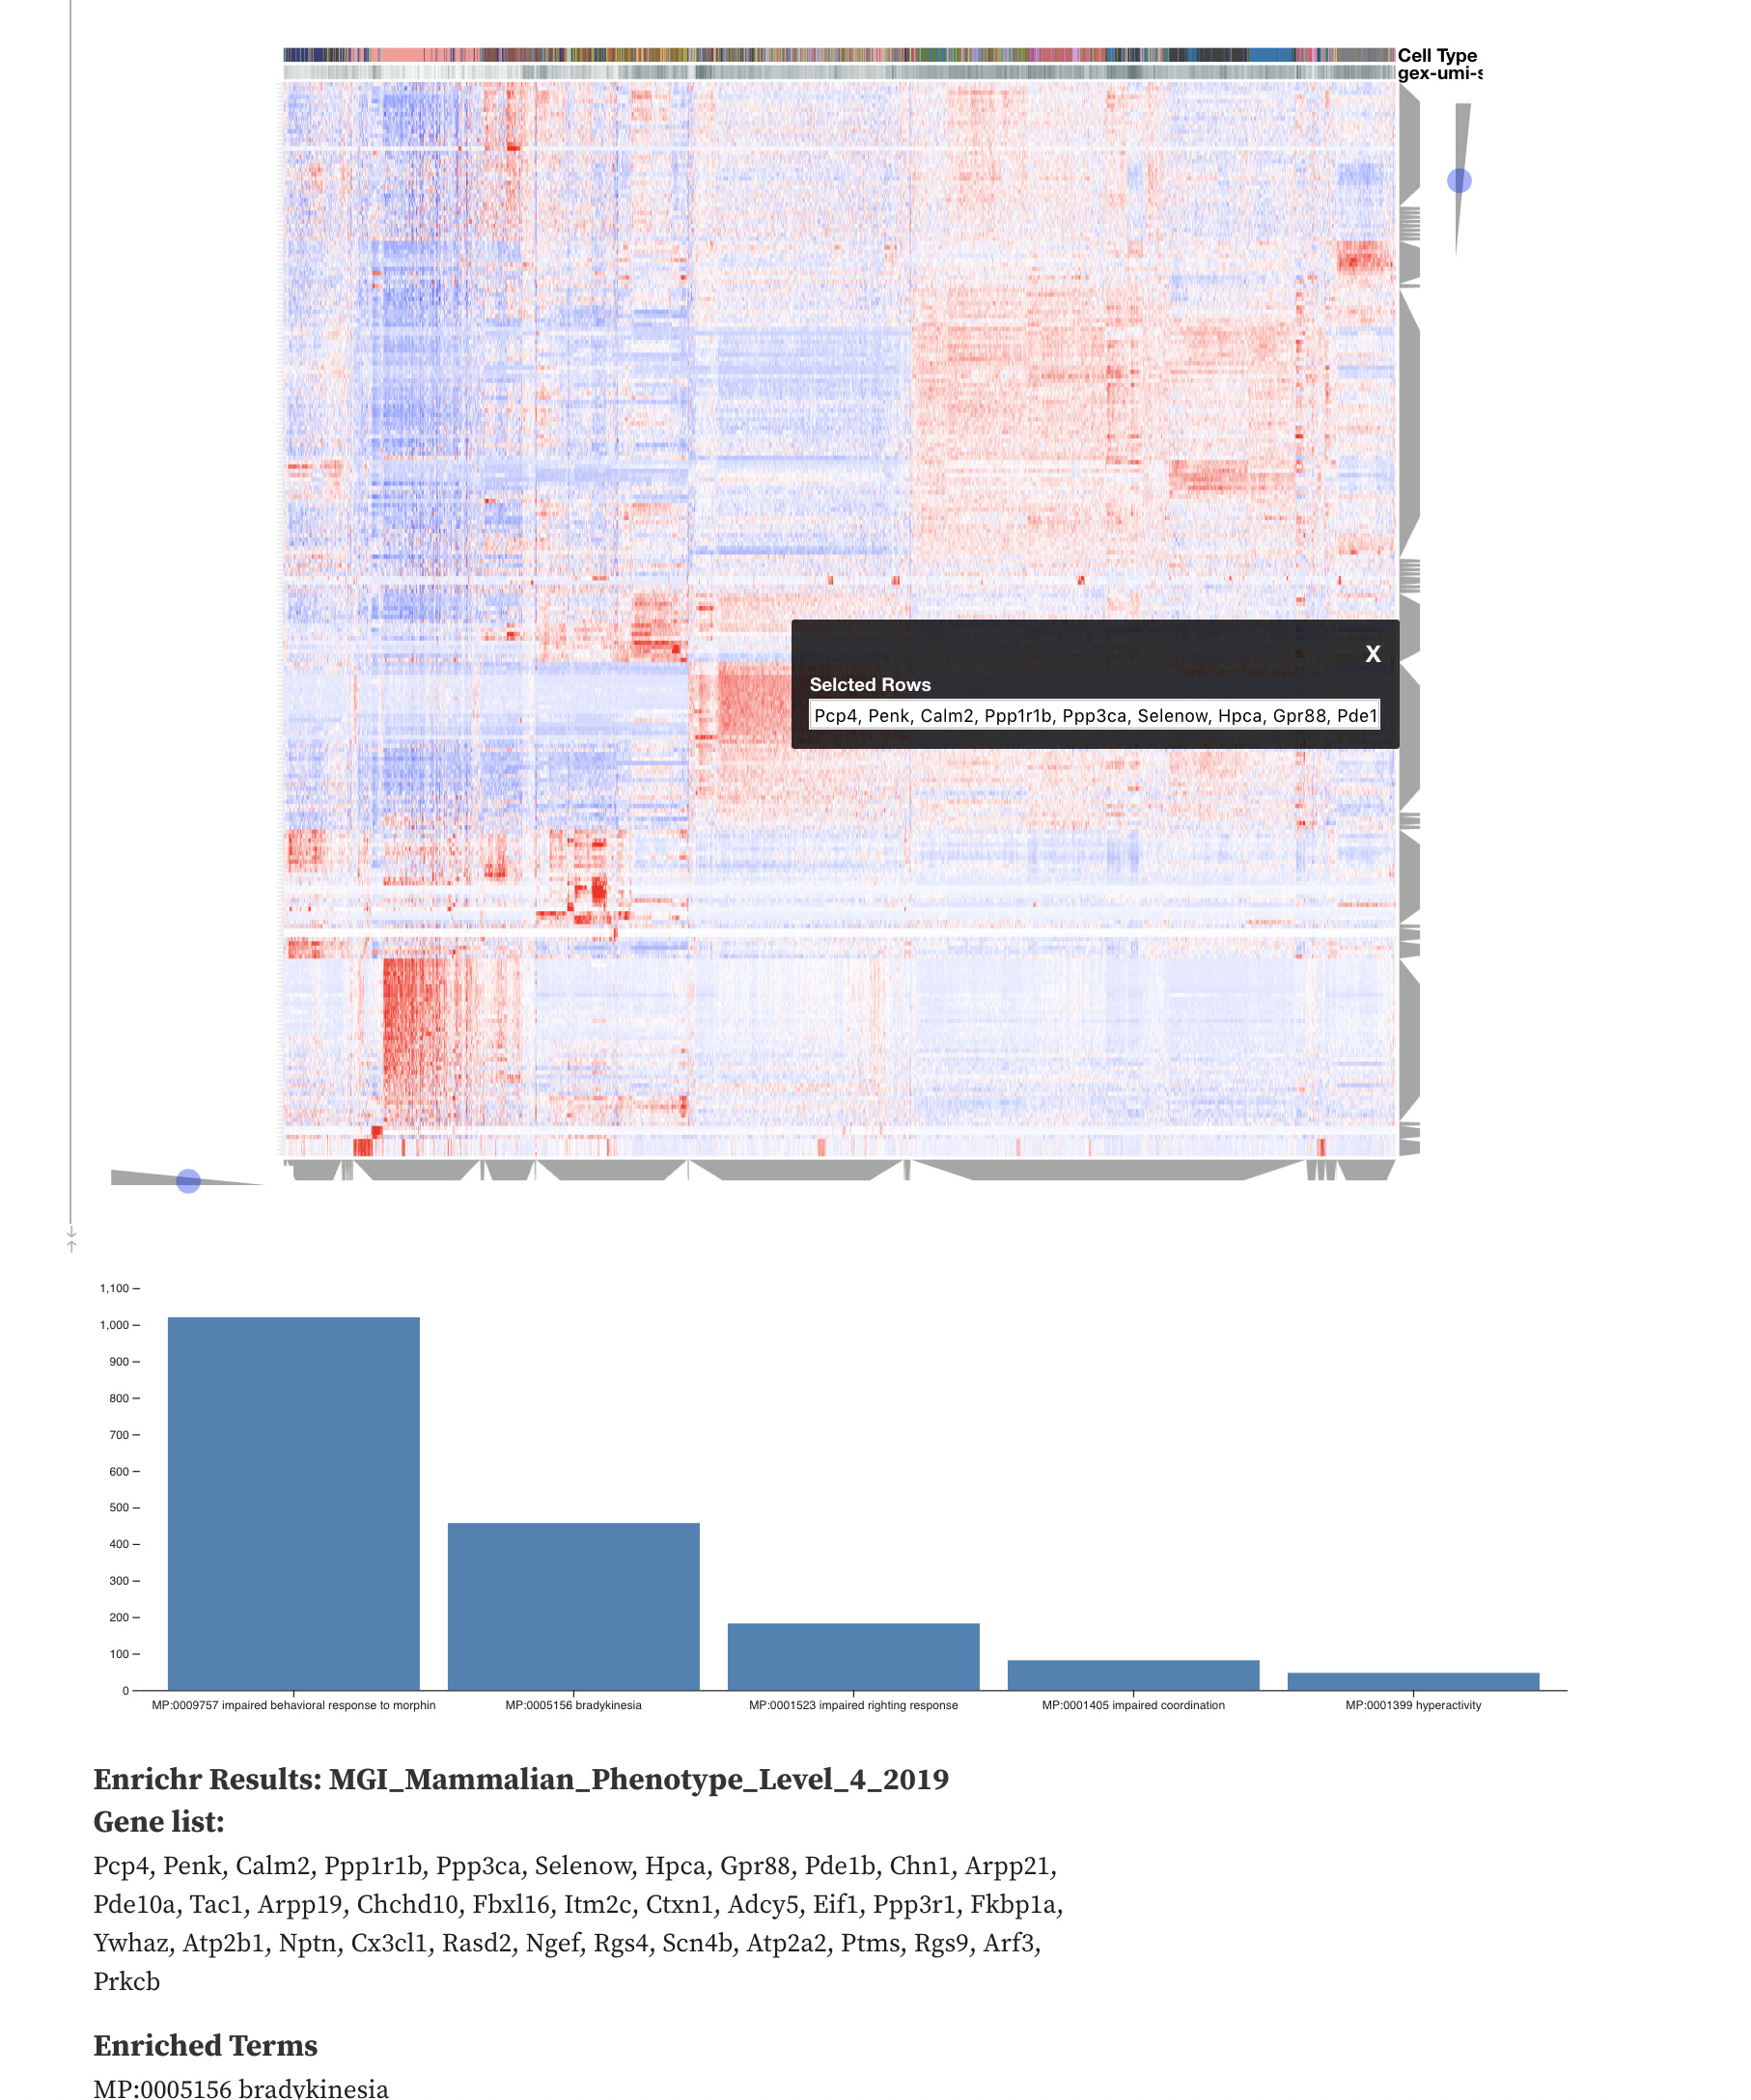
Would we be able to have the two visuals be displayed side-by-side? I think it would make it easier to quickly select a set of genes and read the enrichment results. I know there is the “View in fullscreen” option that looks like it would give me a wide enough view, but it would be nice to have the wide side-by-side view be the default.
BTW the reactive features of Observable that we’re starting to get working with our library Clustergrammer-GL are great 