Specializing @mootari’s suggestion to your use case, I think you just need to append the styles directly to the SVG. That is, in your chart2 function, create your SVG like so:
const svg = d3.select(DOM.svg(width, height));
svg.append("style").html(css);
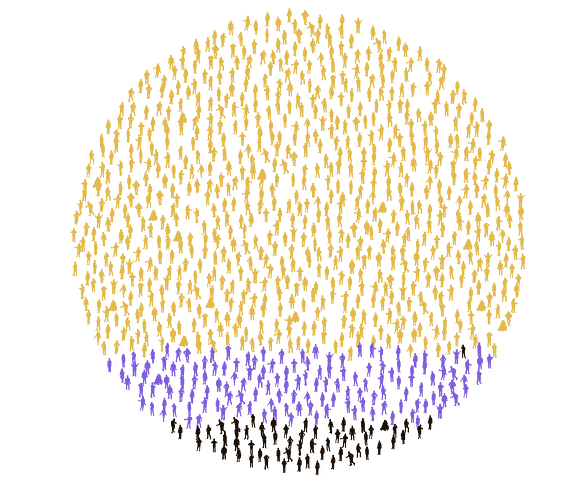
I sent you a suggestion with this approach. Here’s the resulting PNG downloaded from Observable’s export functionality:
