If I create a chart with the Plot-Function
  plot = Plot.plot({

    //...
    //Remaining code omitted for clarity
    //...

    //Add margins to the chart
    marginLeft: 50,
    marginBottom: 50
  })
is there any possibility to read back marginLeft, marginBottom and so on?
For example
  var attributes = plot.attributes;
  console.log(attributes);
does not include any margin info.
Thank you.
1 Like
Fil
September 17, 2022, 1:14pm
2
Nothing like this exists—although you might be able to read the dimensions of, say, the rect created by a Plot.frame, in some cases. It would be interesting to understand the use case.
Ok, you are right. I don’t need the margins.
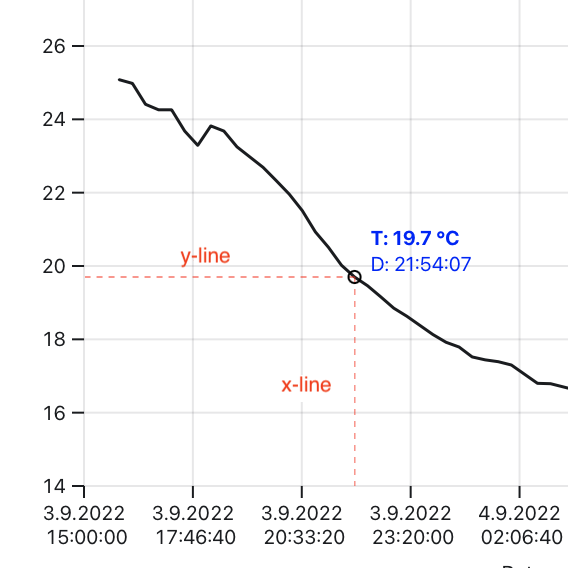
For example to draw the x-line I used
//Remaining code omitted for clarity
.attr("y2", svgDim.height - 50 - scaleTemp.apply(d.temperature));
where 50 is the bottom margin of the diagram.
But if I use the domain I don’t need the margins
const yDomain = dataPlot.scale("y").domain
//Remaining code omitted for clarity
.attr("y2", scaleTemp.apply(yDomain[0]) - scaleTemp.apply(d.temperature));
Here is the link to the notebook . And here is the affected cell Mousemove event .
Thank you.
2 Likes